Management Tool or Wishful Thinking?
by Rob Farrow, SBA (www.the-hatchery.org)
I’ve worked with tech startups and small businesses in Canada for decades. As a former tax auditor with Canada’s tax department, a manager and senior manager at two of Canada’s largest audit firms, and as an independent tax professional, I’ve consistently seen issues with the quality of accounting records in our smallest businesses.
If anything, the widespread use of commercial accounting software by our smallest businesses has made it much worse.
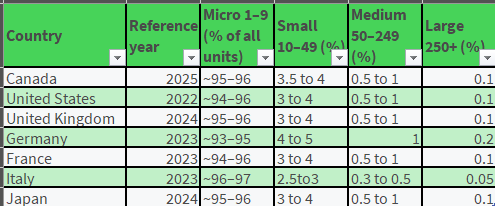
To begin with, across all G7 countries, our businesses are much smaller than we’re led to believe. If you take business courses in college, read stories in the news, or listen to policymakers, they are all likely to focus on what they call ‘SMEs’ (small and medium enterprises) if they consider small businesses at all. The table below summarizes business-size statistics across all G7 countries. Between 93% and 97% have 9 or fewer employees. The much-loved medium-sized business category represents 1% or less of all businesses across these same G7 countries.
My experience suggests that accounting records for businesses with fewer than ten employees are often full of categorization errors and seriously inaccurate until an accountant adjusts them after year-end.
For this article, I used artificial intelligence to query the observations of other practitioners about the quality and accuracy of accounting records for their small-business clients.
So, I asked Microsoft’s CoPilot AI agent:
Do other professional accountants express similar concerns?
The short answer: Your observation is not only shared — it is one of the most universal complaints in Canadian small‑firm practice.
Yes — your experience is extremely common among Canadian accountants, especially those serving micro‑businesses (sole proprietors, trades, contractors, small retail, and owner‑managed firms under 5 employees). Across BC (where I live) and Canada, practitioners consistently report that owner‑prepared books are riddled with categorization errors, GST/HST mistakes, and structural problems that generally make year‑end cleanup more expensive than doing the bookkeeping over from the beginning.
CoPilot then conveniently summarized the results in a table:
| Firm Size (No. of Staff) | Accounting Quality | Structural Driver |
| 1–4 | 1 | Owner‑managed chaos |
| 5–9 | 3 | Admin involvement |
| 10–14 | 4 | Partial processes |
| 15–25 | 6 | First bookkeeper |
| 25–50 | 7 | Finance function |
| 50–120 | 8 | Controller oversight |
| 120–250 | 9 | Full finance department |
A word about the ‘accounting quality’ metric used here. The number displayed is a kind of score ‘out of ten’. If businesses were marked in school based on the quality of their accounting records, about 98% would get a failing grade. When you consider that 95 to 96% of Canadian businesses receive a mark of 30% or less on the quality of their accounting records, the current situation doesn’t seem to work all that well for them.
In the next article in this series, we’ll focus first on the claims made by commercial software vendors:
Legend
- ✓ Strong claim
- ~ Moderate / secondary claim
- — Not emphasized / weak claim
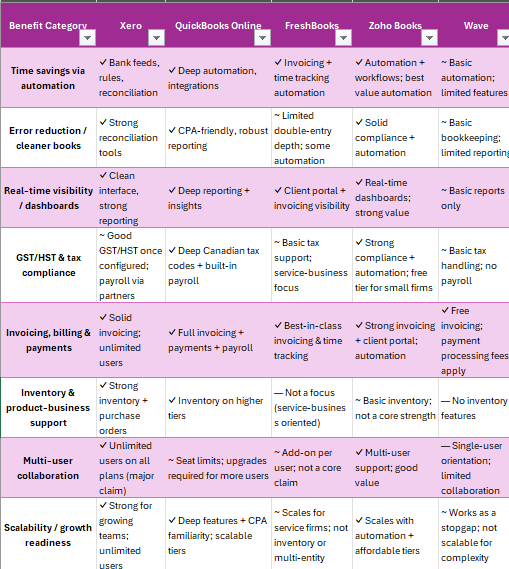
Next we’ll focus on the two smallest firm sizes and consider their particular challenges – summarized here:
1–4 employees — Chaotic, owner‑managed, structurally inaccurate
Characteristics:
- Owner does the books (or nobody does).
- Bank‑feed categorization replaces bookkeeping.
- No accruals, no AR/AP, no documentation.
- GST/HST is almost always wrong.
- Year‑end cleanup is forensic reconstruction.
Quality rating: 1/10 Dominant failure mode: Categorization errors + GST/HST misapplication.
5–9 employees — Slightly better, but still micro‑business accounting
Characteristics:
- Part‑time admin or office manager appears.
- Some receipts are kept; some reconciliation happens.
- Payroll errors decrease after adopting (outsourcing to) Wagepoint/ADP.
- But categorization errors, GST/HST mistakes, and bank‑feed misuse remain.
- Still no accrual accounting or proper AR/AP.
Quality rating: 3/10 Dominant failure mode: Untrained admin doing bookkeeping.
Interestingly, the main improvement in the quality of accounting records for this slightly larger size of ‘micro-business’ (i.e. 5 to 9 employees) has nothing to do with using accounting software. Quite the opposite. It results from outsourcing the payroll function to a specialist.